

Open the Lineage Explorer
The Lineage Explorer shows your components — services and data stores — connected by cross-service edges. The graph loads the component topology first, then fills in field-level details in the background.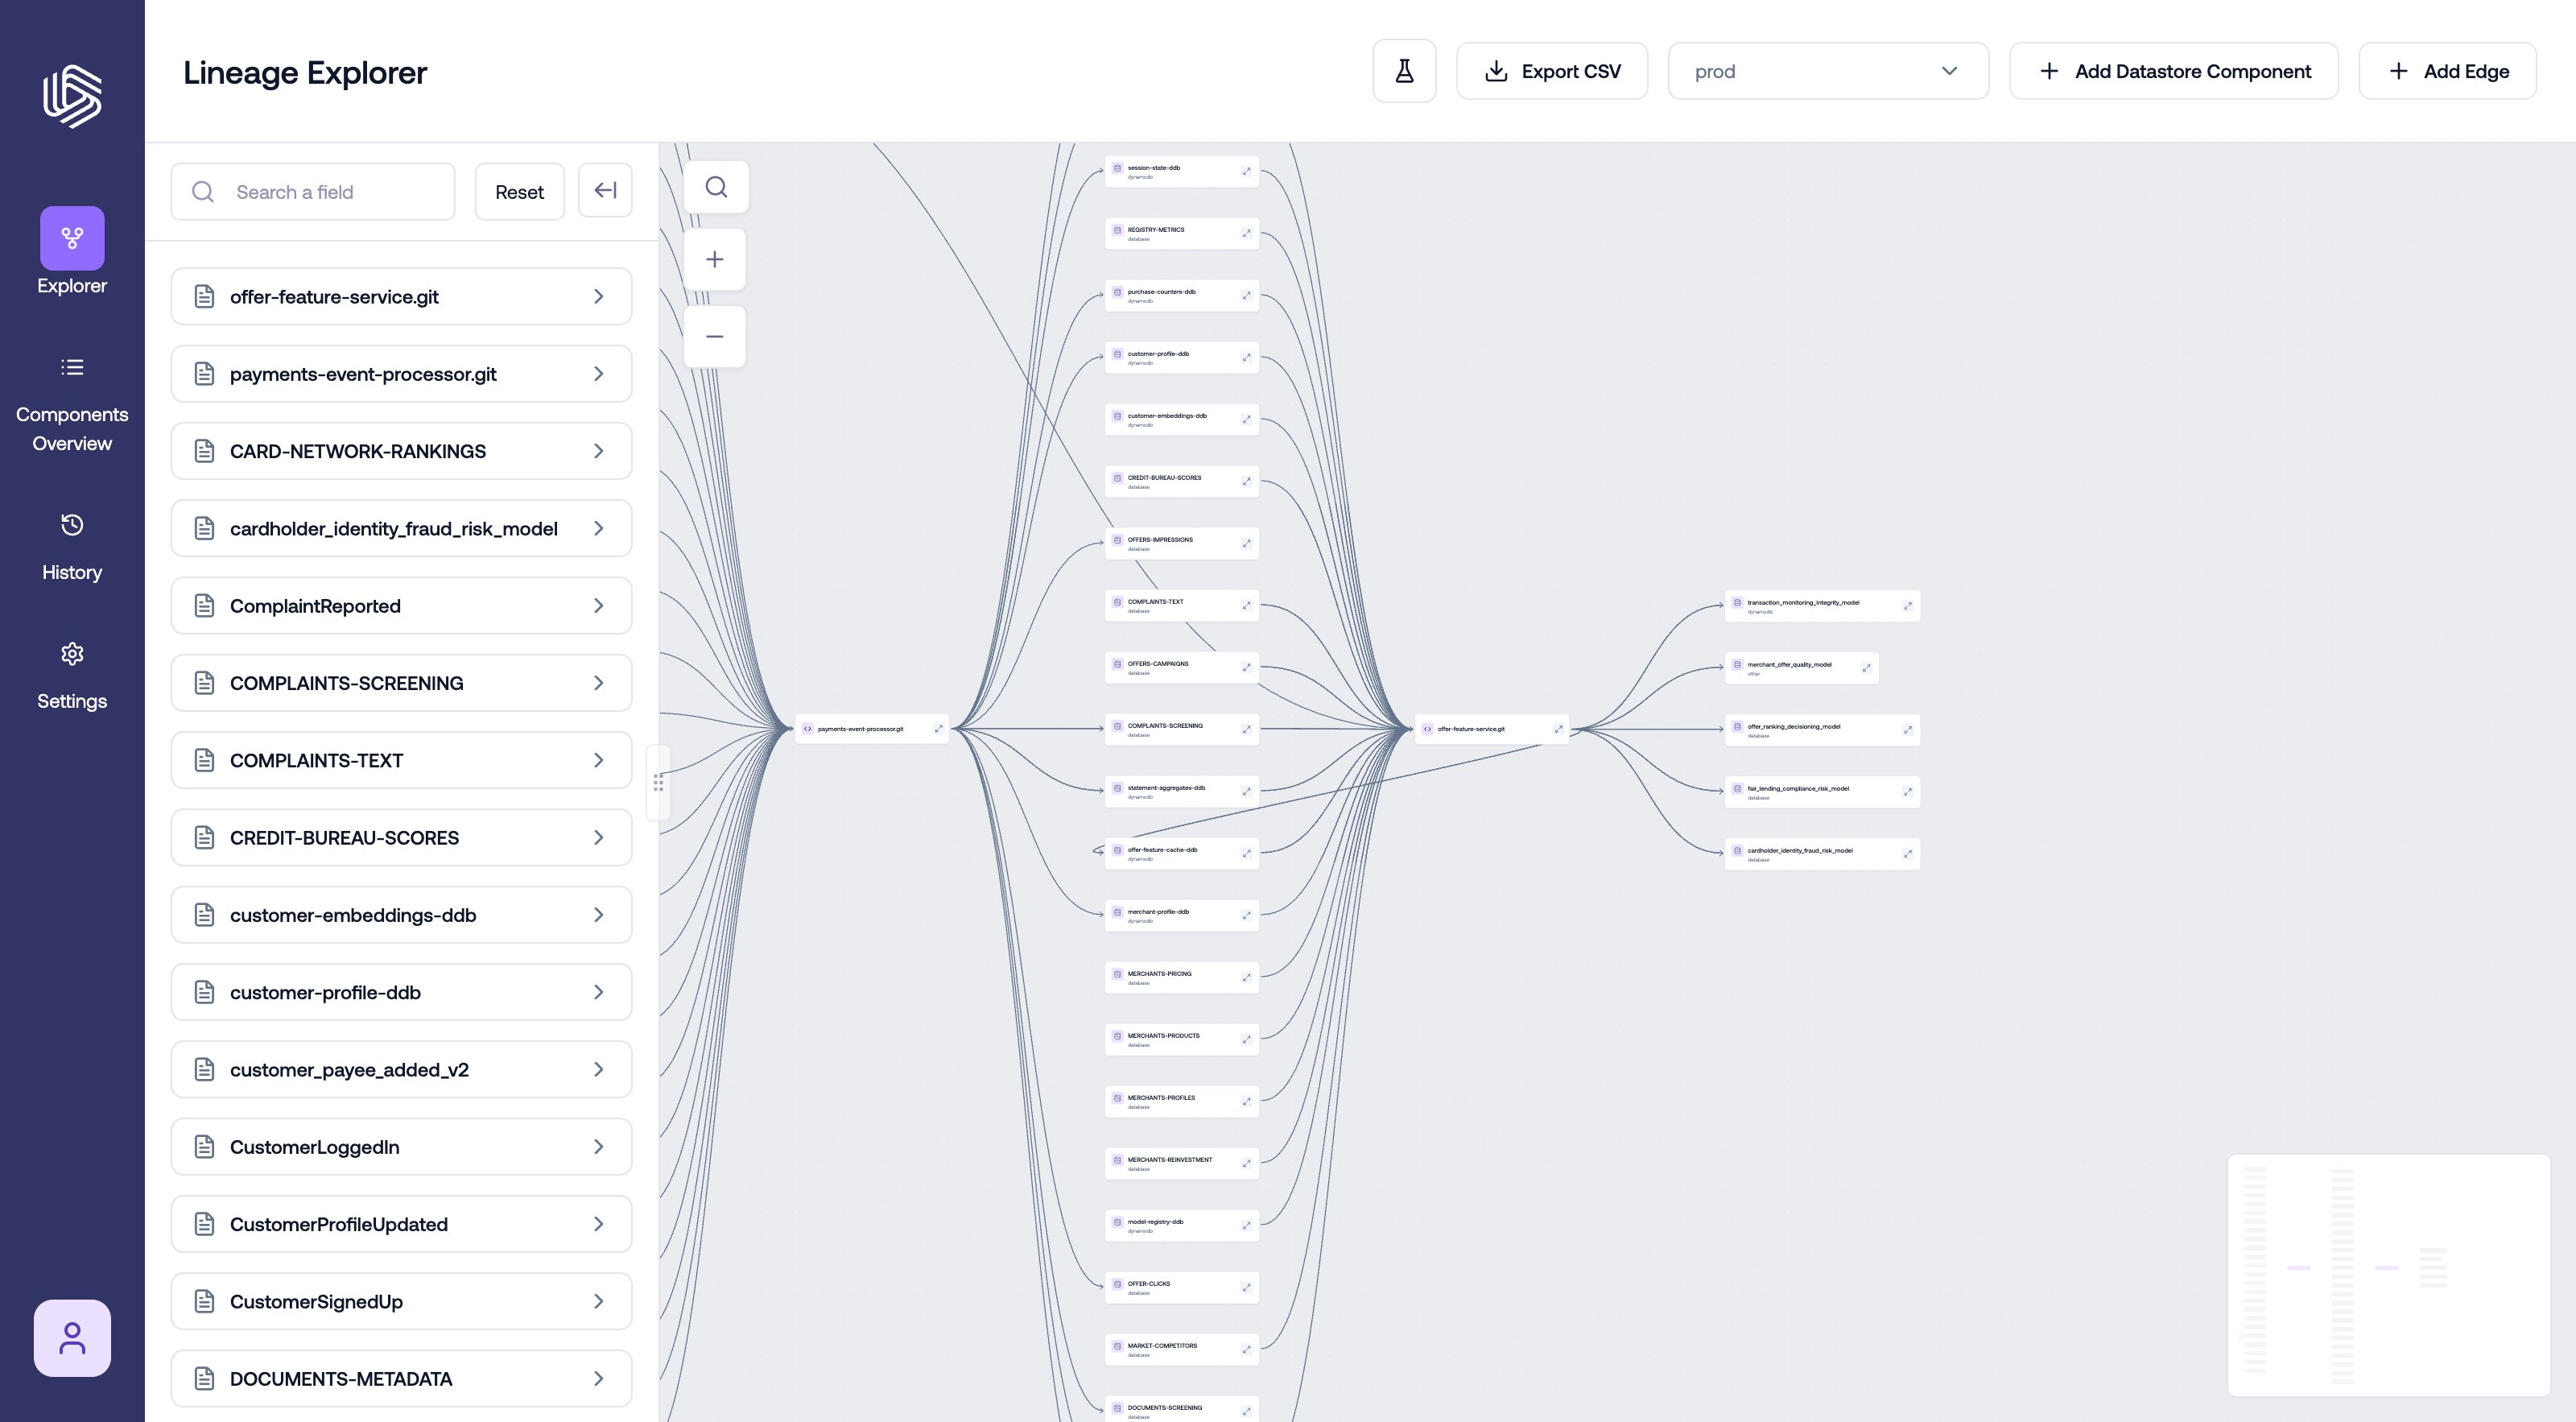
The Lineage Explorer graph
Trace a field
- Open the field search sidebar and search for the field you want to trace.
- Select the field from the results. You can select multiple fields to trace them together.
- The graph filters to the selected fields, showing the field-level connections between components — which upstream fields feed the selection, and which downstream fields consume it.
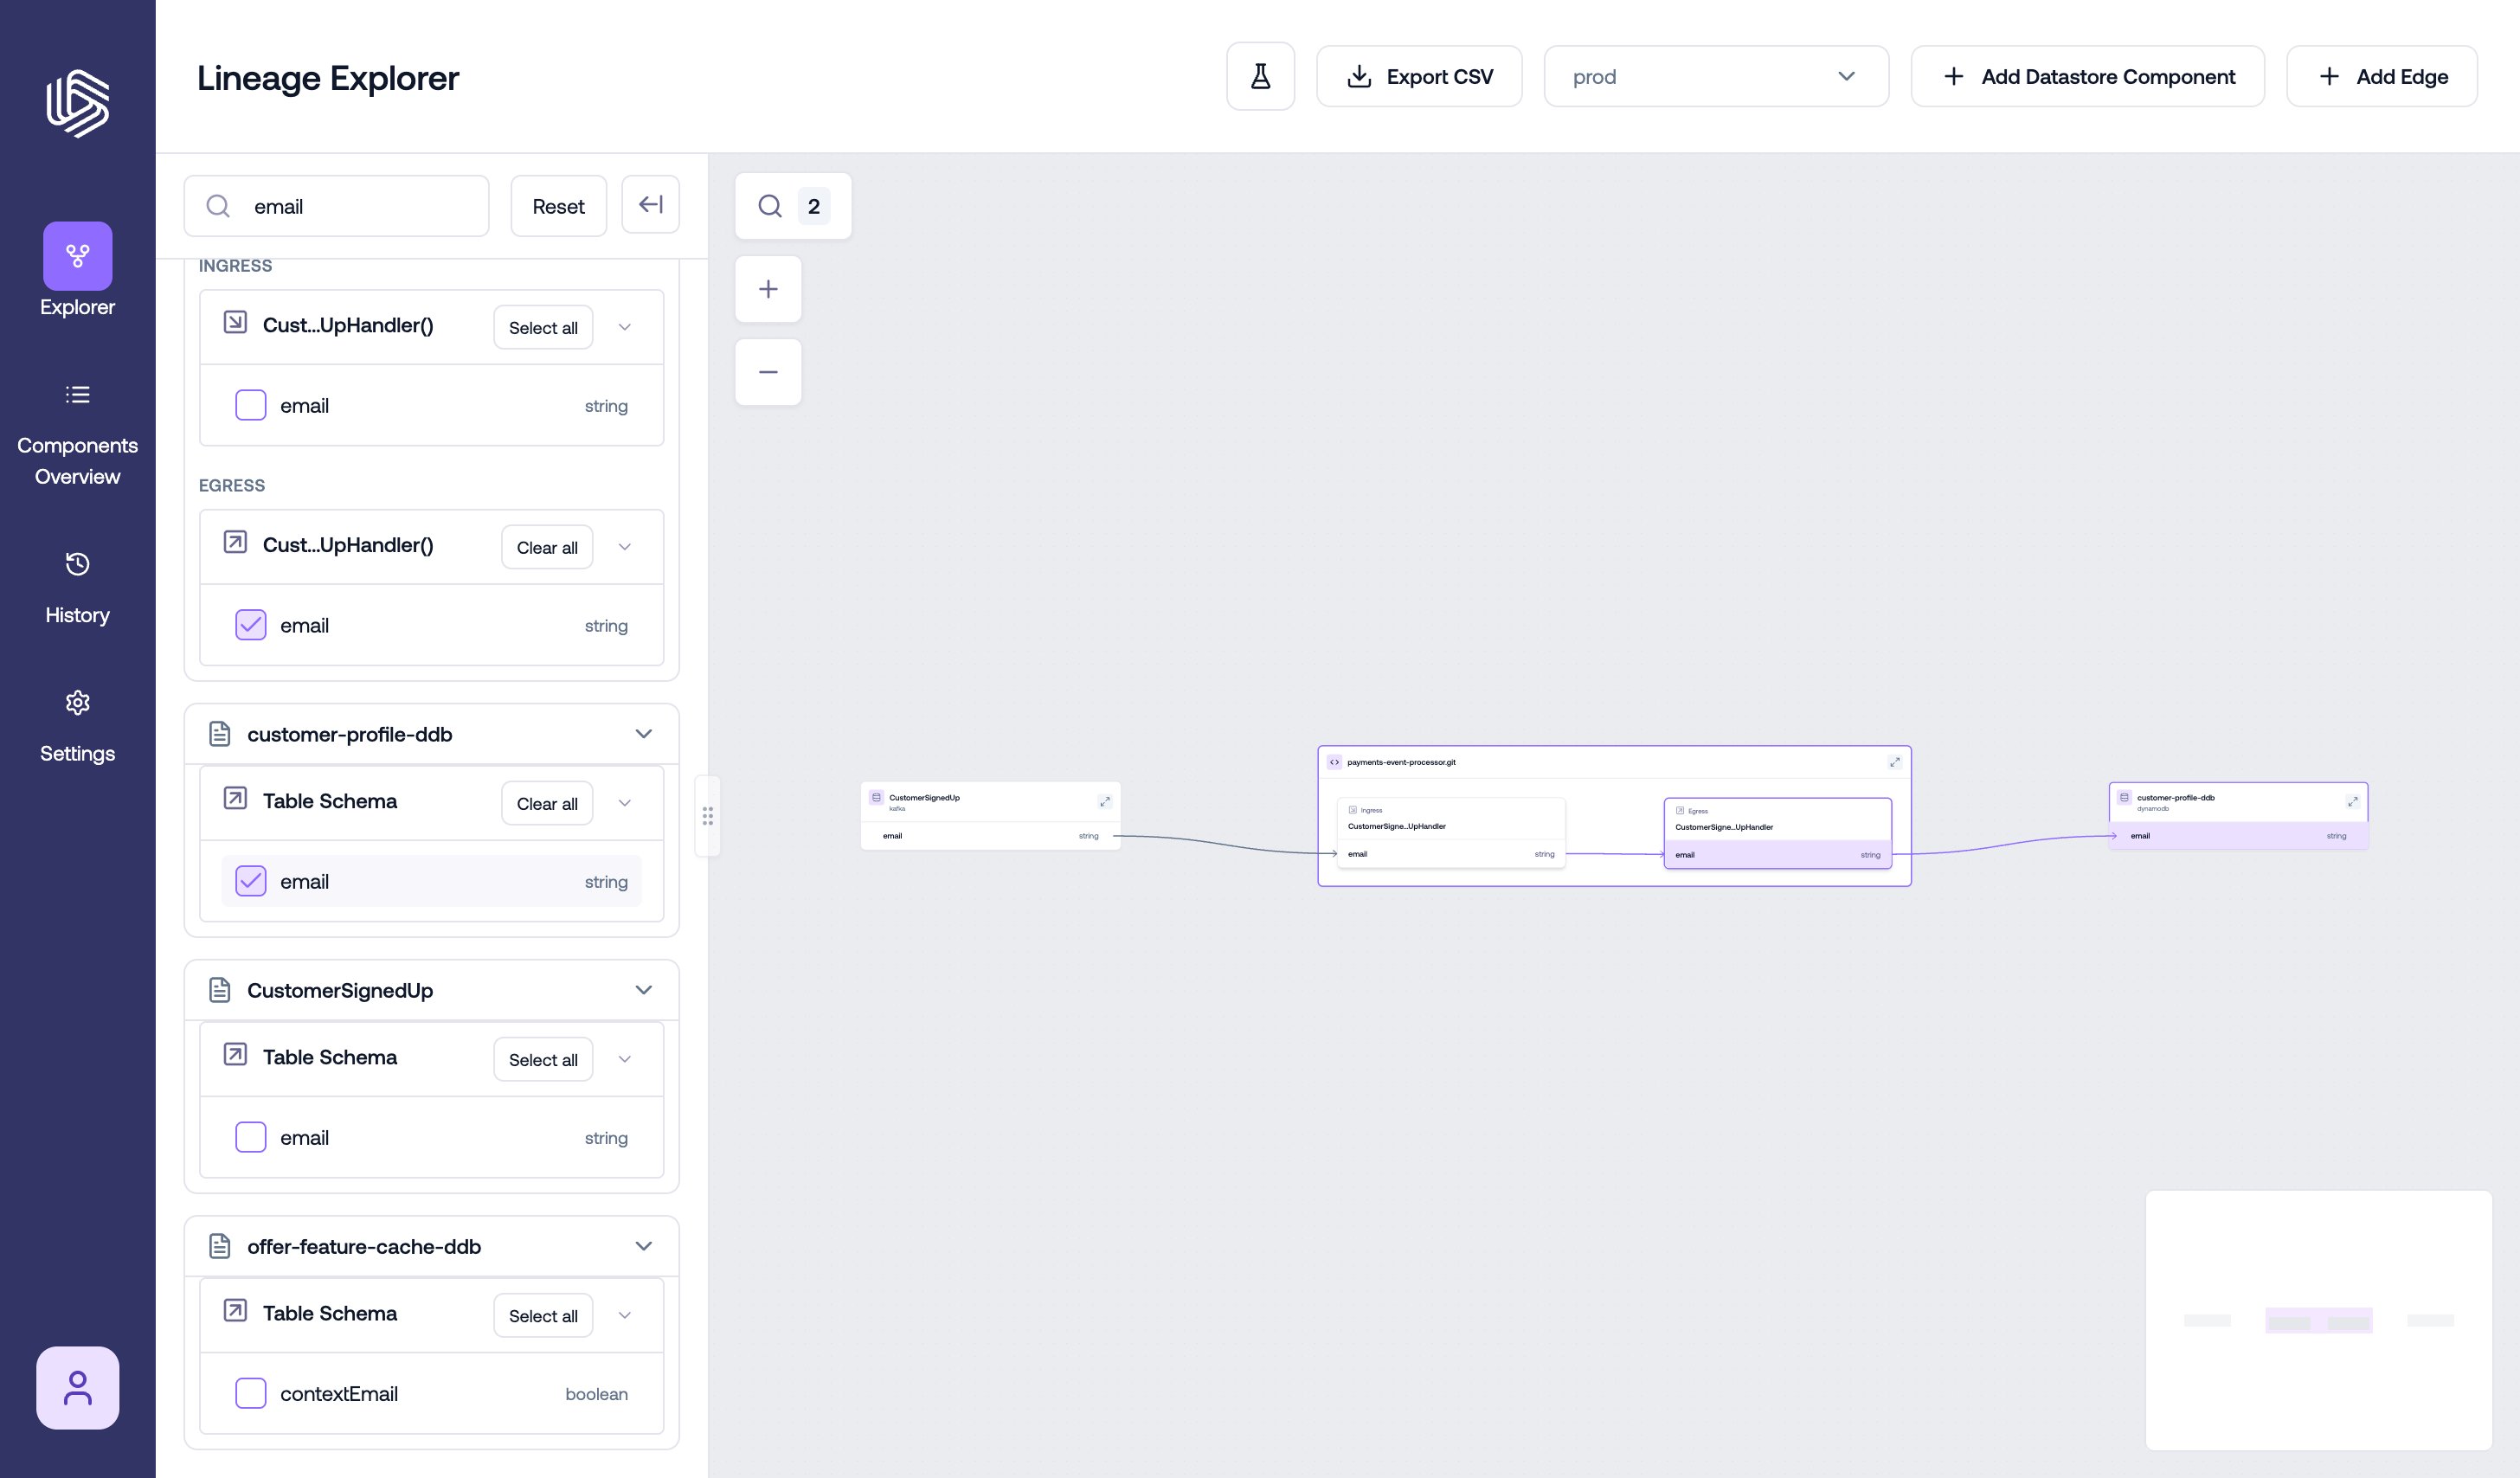
Field-level lineage for a selected field
- an egress field on one service connects to an ingress field on another service, or to a data store column
- within a service, ingress fields connect to egress fields through the service’s internal paths
Inspect a mapping in a component
To understand how a single service produces a field, open its Component Details page (select the service in the Lineage Explorer and open its details).- Open the Known dependencies section, which lists the component’s field mappings — each ingress field and the egress field it becomes.
- Select a mapping to open its details, including the code paths that produced it.
- Review the code path steps to see where the value is read, how it is transformed, and where it is written.
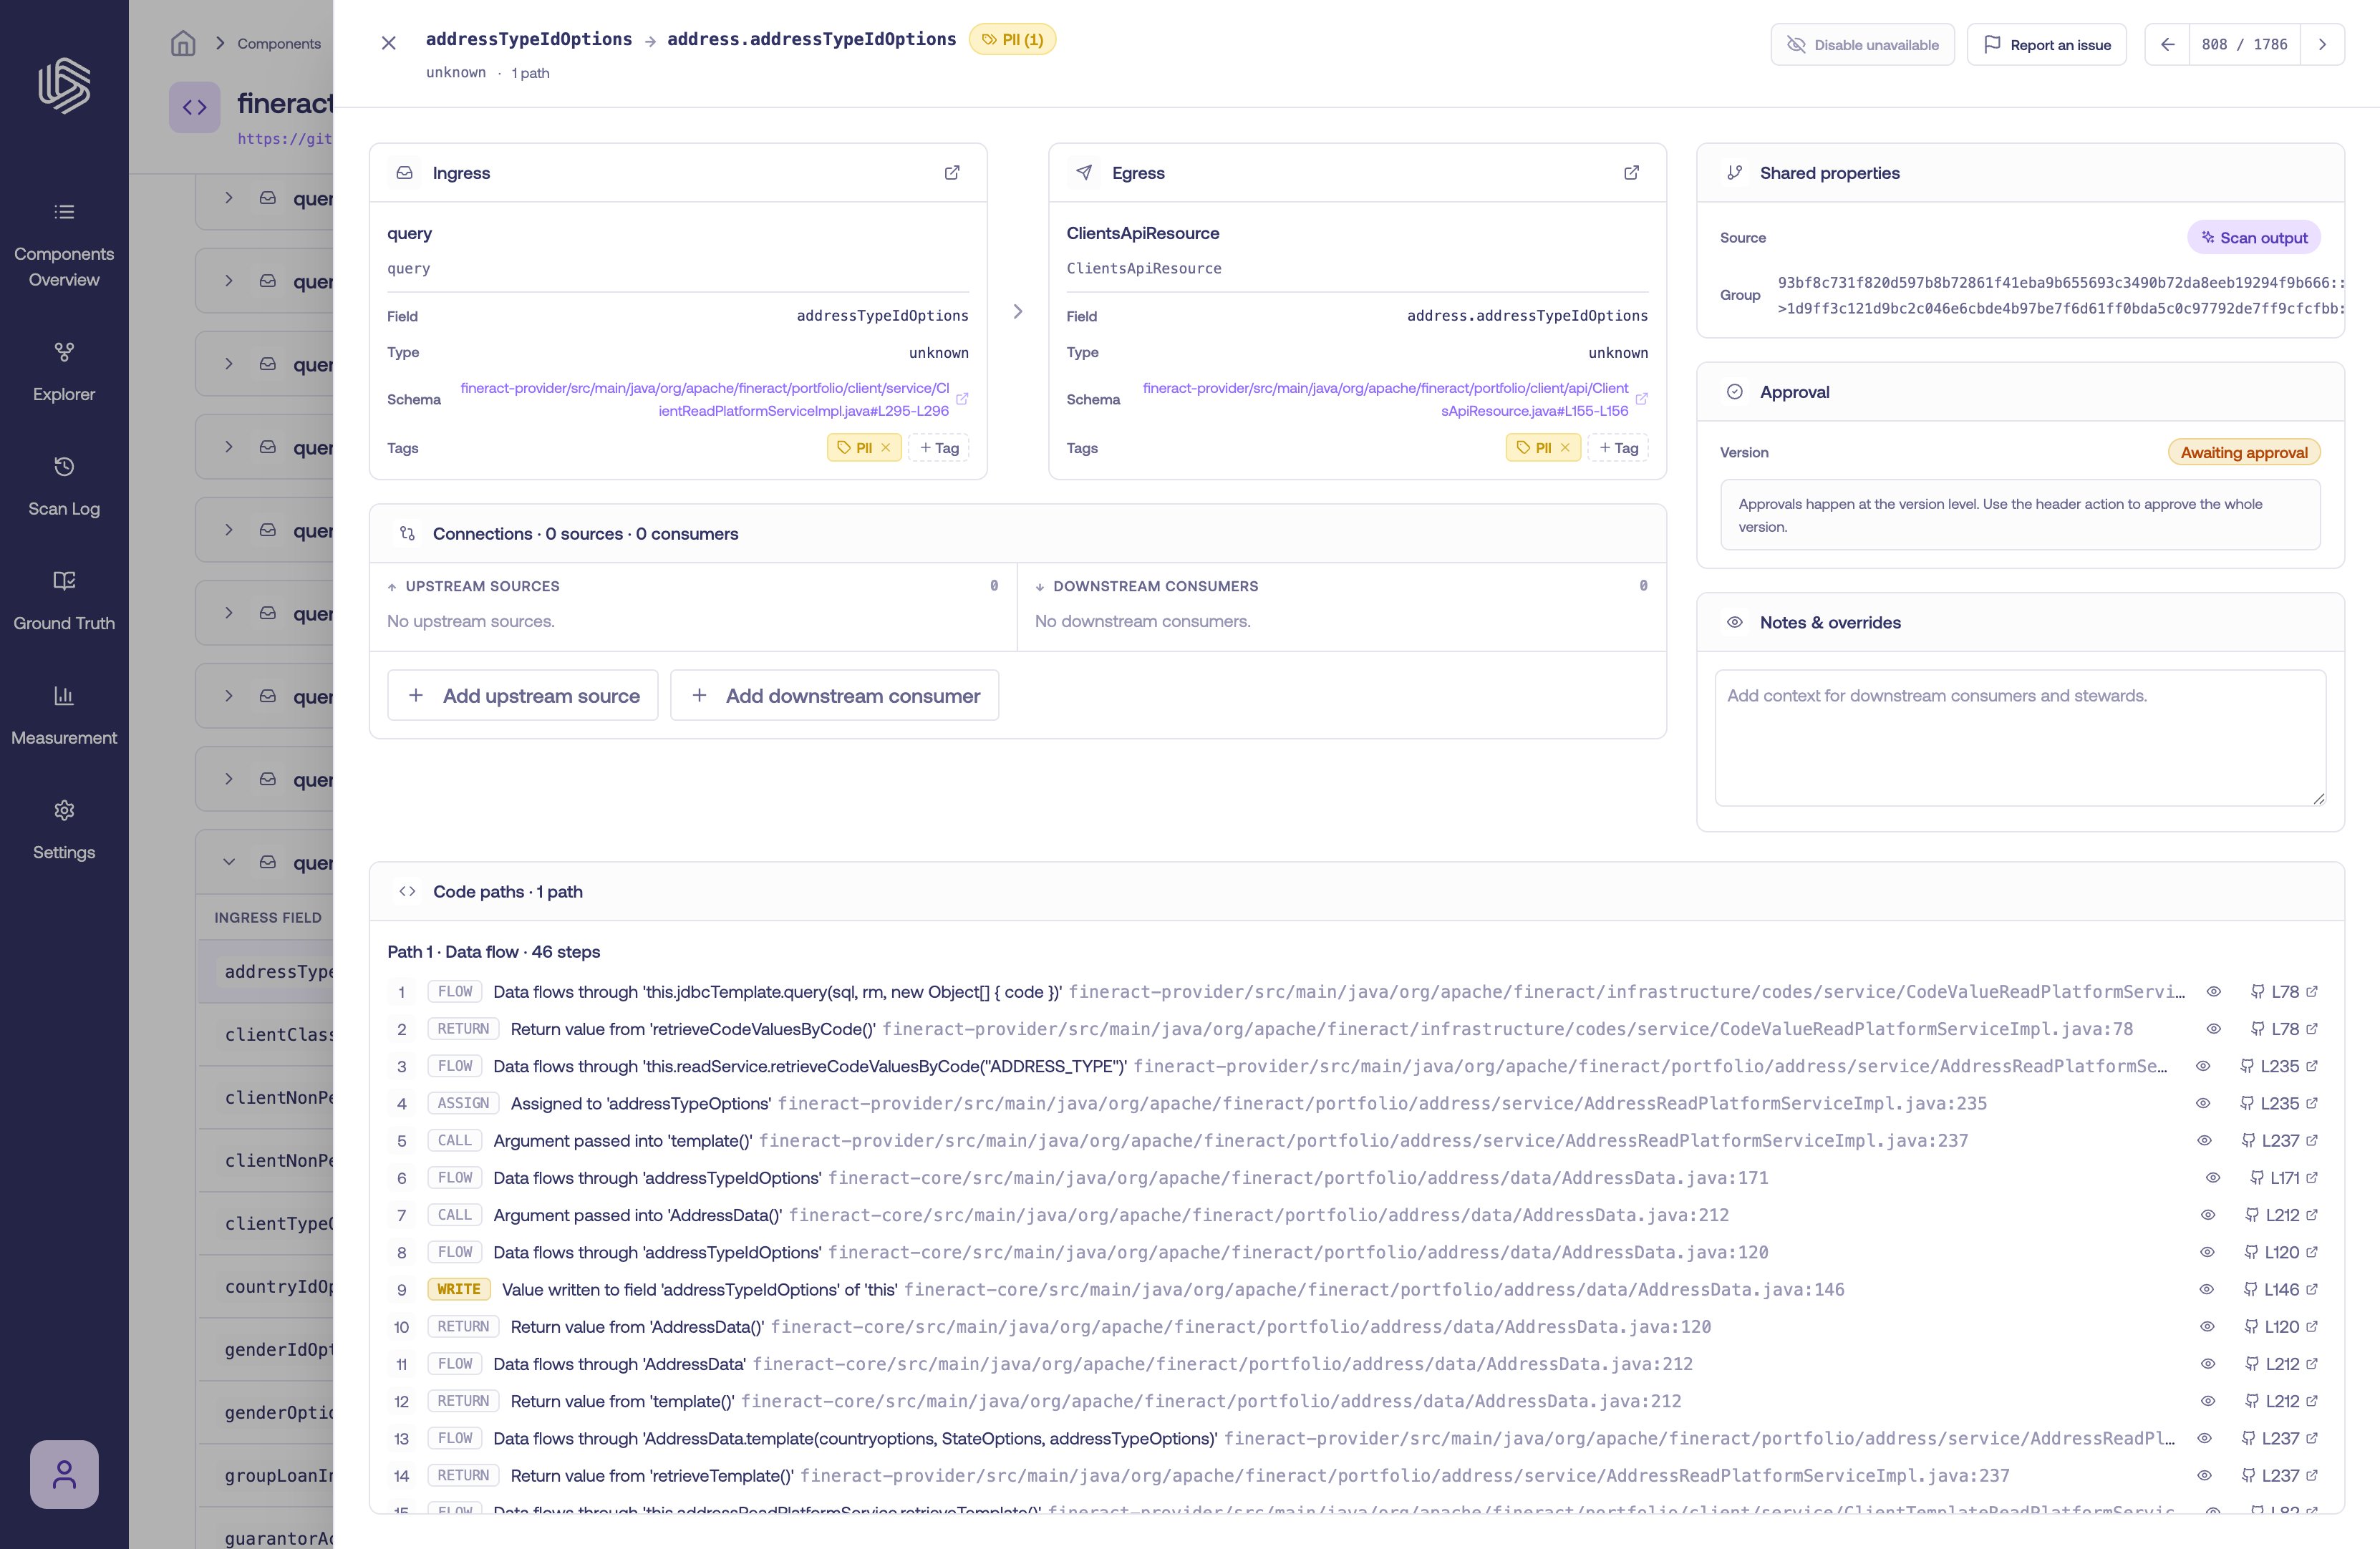
A field mapping's details on the Component Details page
Next steps
- Export the trace for reporting or review — see Exporting Lineage.
- Understand how lineage changed between versions — see Reviewing Version Changes.
- If a trace doesn’t match your expectations, see Understanding the Source of Lineage Issues.