

Trace the regulated data
- Open the Lineage Explorer and search for the regulated or sensitive field — for example, an output field of a report, feed, or API response.
- Select the field to filter the graph to its lineage.
- Trace upstream to confirm every source that feeds the field: which services touch it, which data stores hold it, and where it originally enters your systems.
- Trace downstream to identify every consumer that depends on it.
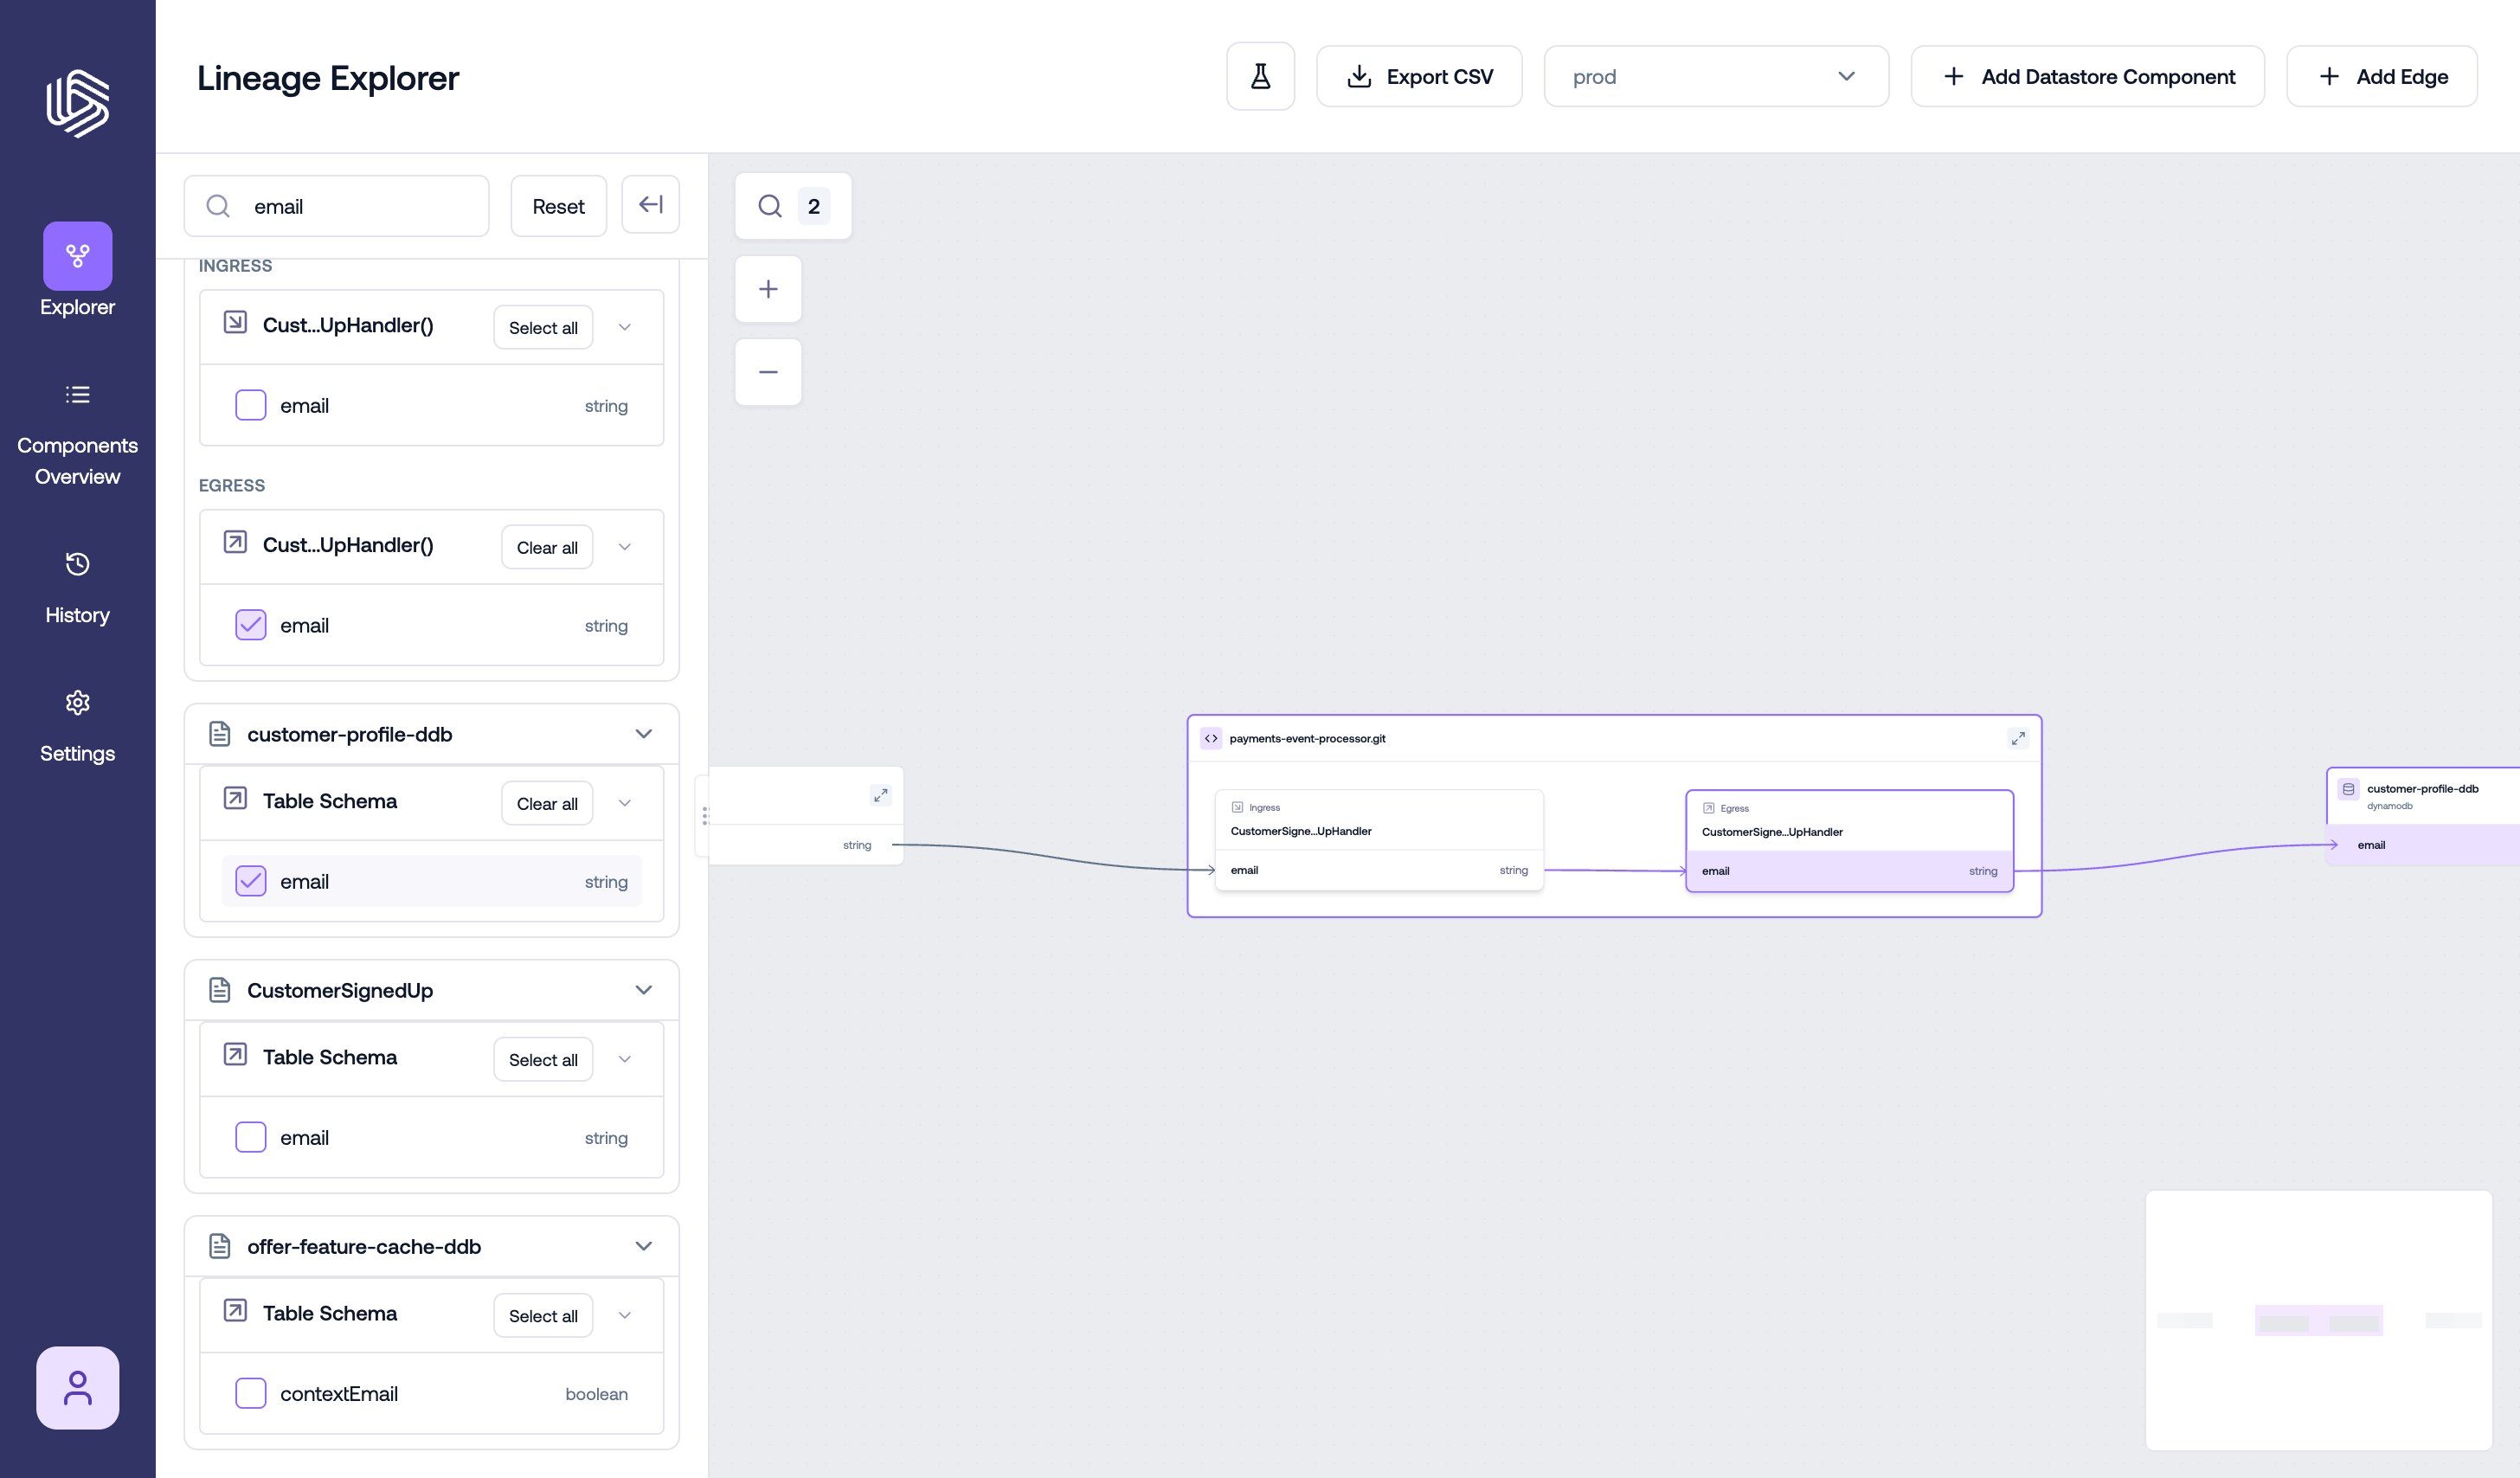
Tracing a regulated field upstream across services
Show how the data is computed
For each service along the path, open Component Details to show what happens to the data inside the service:- the path connecting the relevant ingress and egress
- the field mappings along that path
- the field data flow — the steps the value takes through the code
Export the evidence
Capture the trace as an artifact for the review:- CSV export — with the field selected in the Lineage Explorer, use Export CSV to download the upstream lineage paths for the field, hop by hop. See Exporting Lineage.
- API export — for the complete lineage of a run (components, schemas, and edges), use the Lineage Export API.
Anchor the evidence to a point in time
Every version of a component’s lineage is tied to an analysis run of a specific commit:- The Scan Log records every analyzed version, with its branch, commit, and analysis timestamps — a durable record of when each version of the lineage was produced and from what code.
- To show how data handling changed between two audits or releases, compare the corresponding versions — see Comparing Lineage Versions.
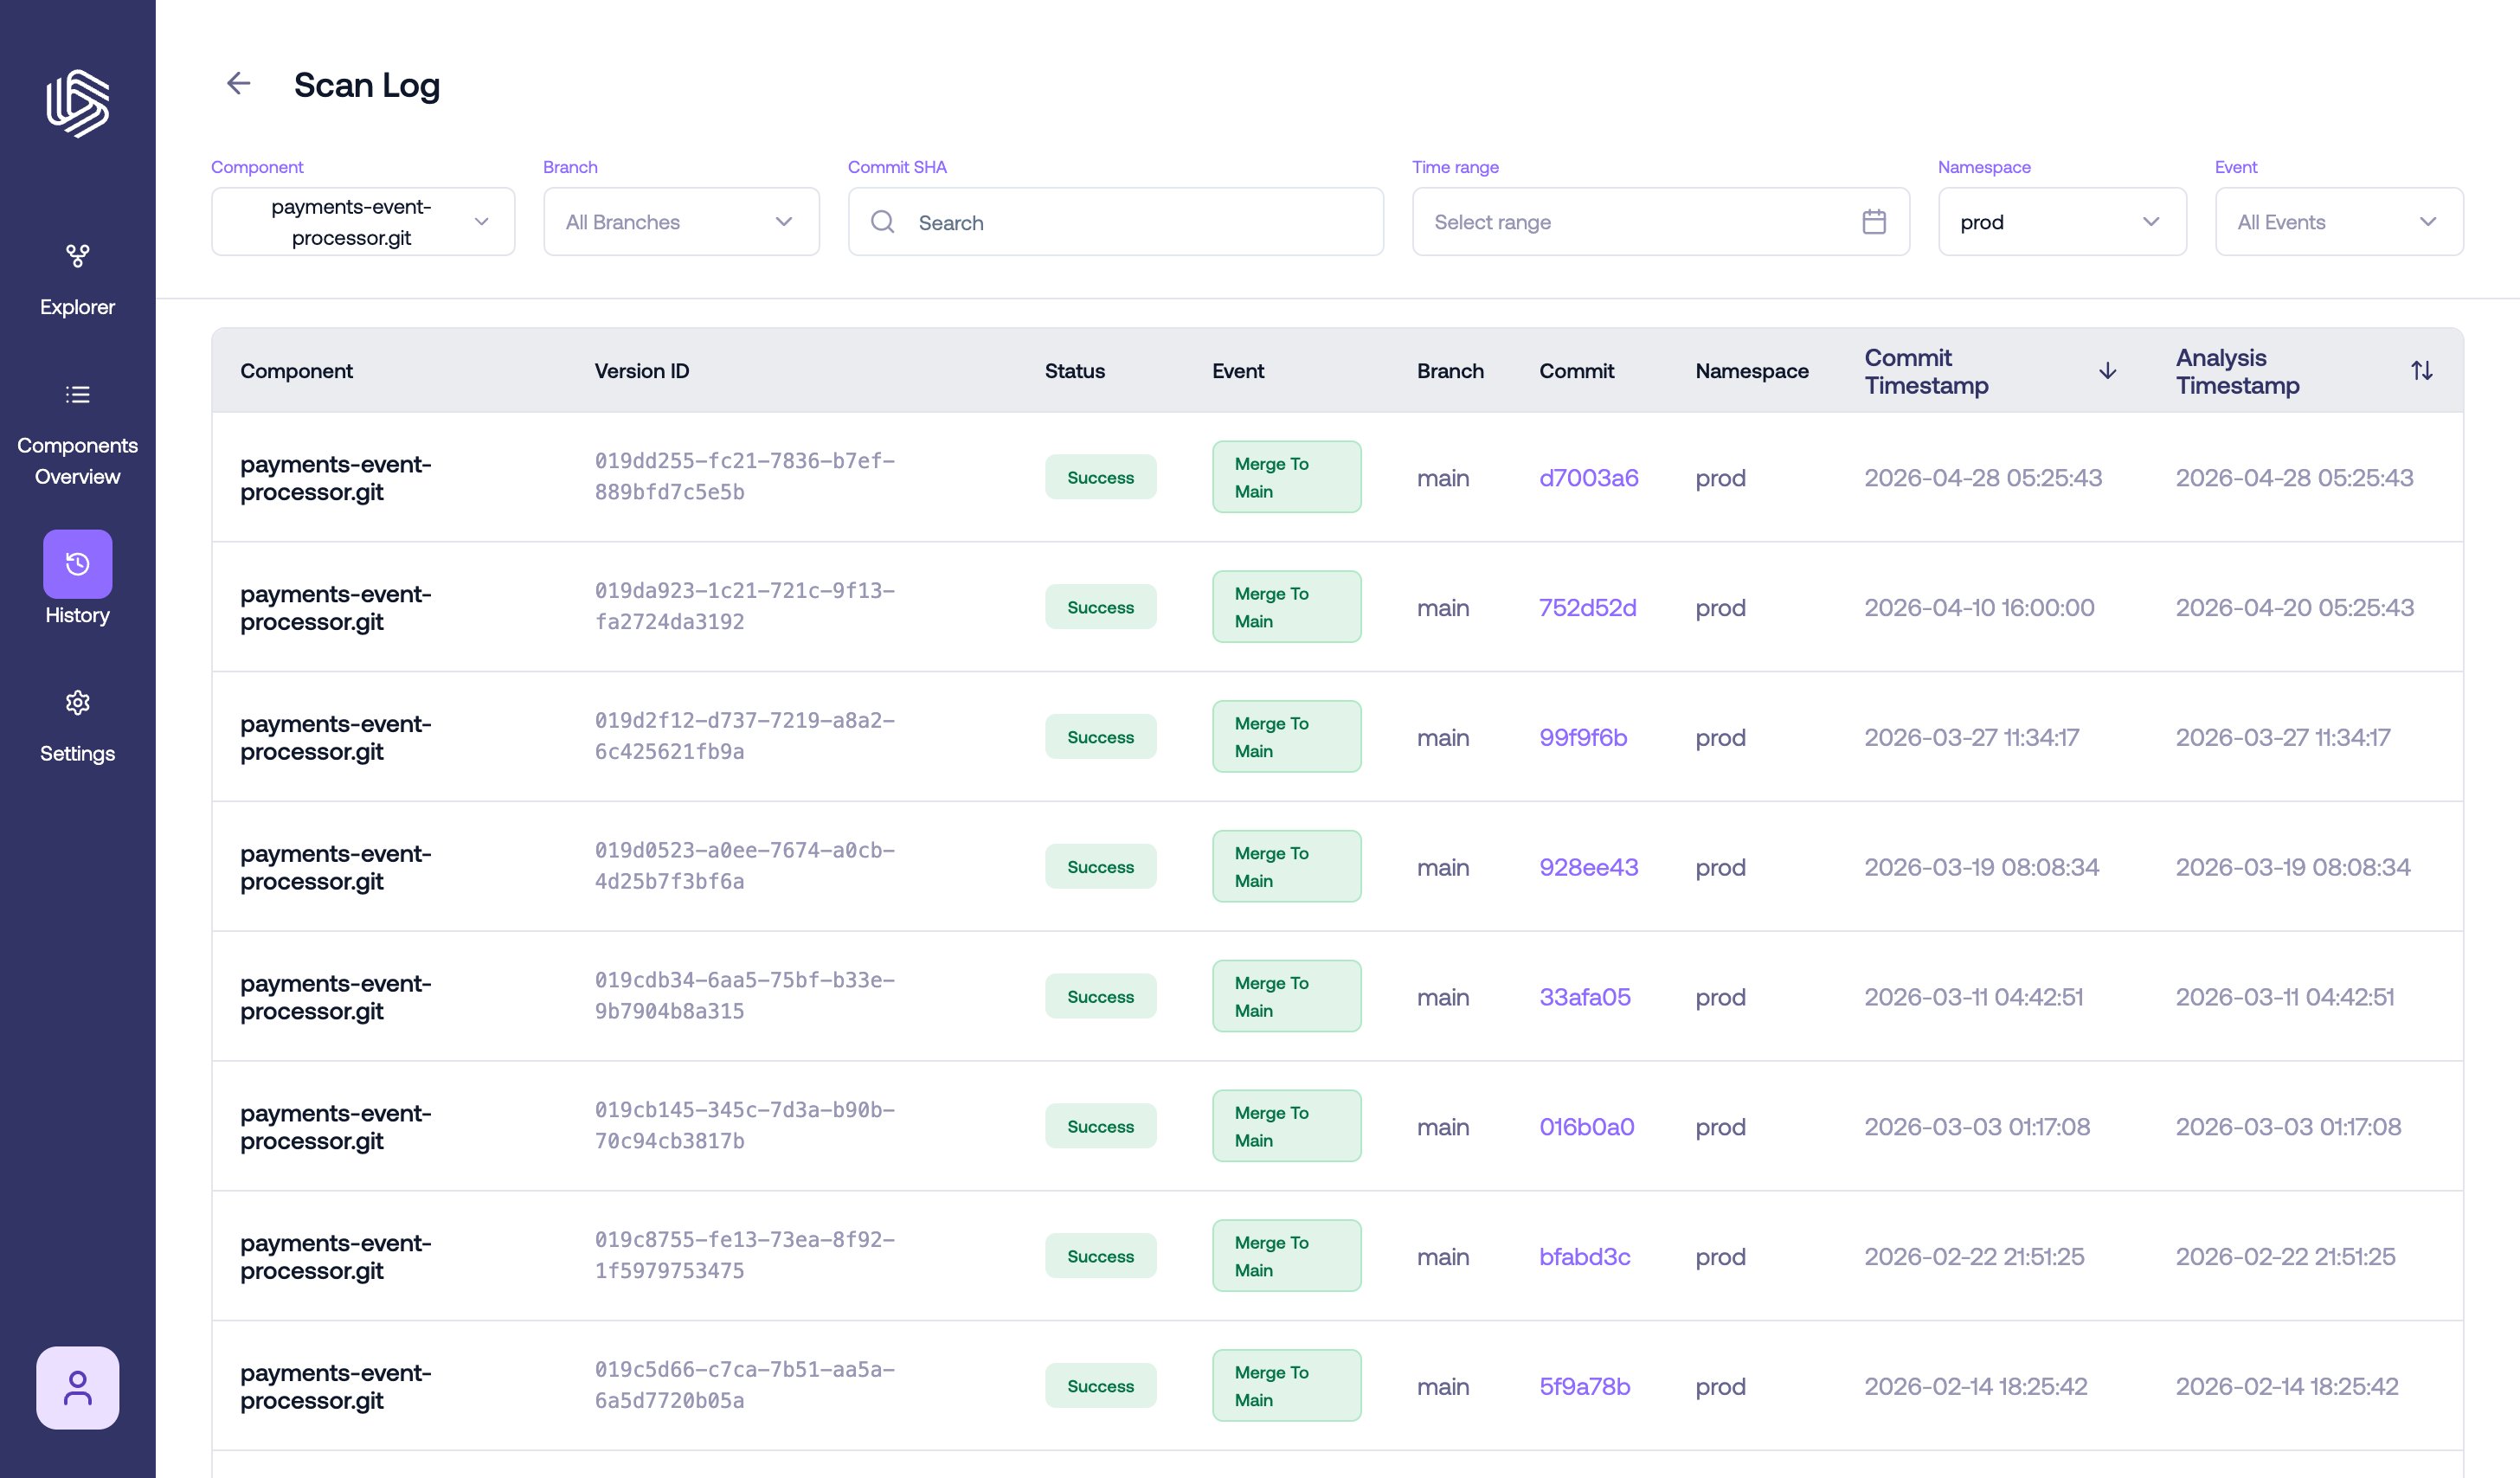
The Scan Log as a point-in-time record of analyzed versions
Coming soon
Two upcoming capabilities will streamline this workflow:- Sensitive Data — start from a classification (such as PII) instead of a known field name, and track classified data across the graph.
- Approvals — sign off on a lineage version to establish the reviewed baseline your evidence is generated from.