

The Known dependencies table
The Known dependencies section lists each field mapping as a row — the Ingress field that enters the service on the left, the Egress field it becomes on the right — along with the following metadata columns:- Kind — how the input participates in producing the output: Data flow (the value itself flows through), Key-value bridge (connected through a shared key), or Control flow (the value influences what is written without becoming it).
- Computation — what the code does to the value along the way: Pass-through (the value is carried unchanged), Calculation (the value is computed or transformed), or Redaction (the value is masked or removed).
- Sources — the number of upstream sources that feed the input field.
- Consumers — the number of downstream consumers of the output field.
- Source — where the mapping came from: Scan output (detected by Gable’s analysis), Override (added or edited by a person), or Disabled (a scanned mapping that has been suppressed).
- Tags — the sensitivity or data tags on the fields, such as PII. See Data Tagging.
- Status — when you are comparing two versions, whether the mapping was added, changed, or removed. See Reviewing Version Changes.
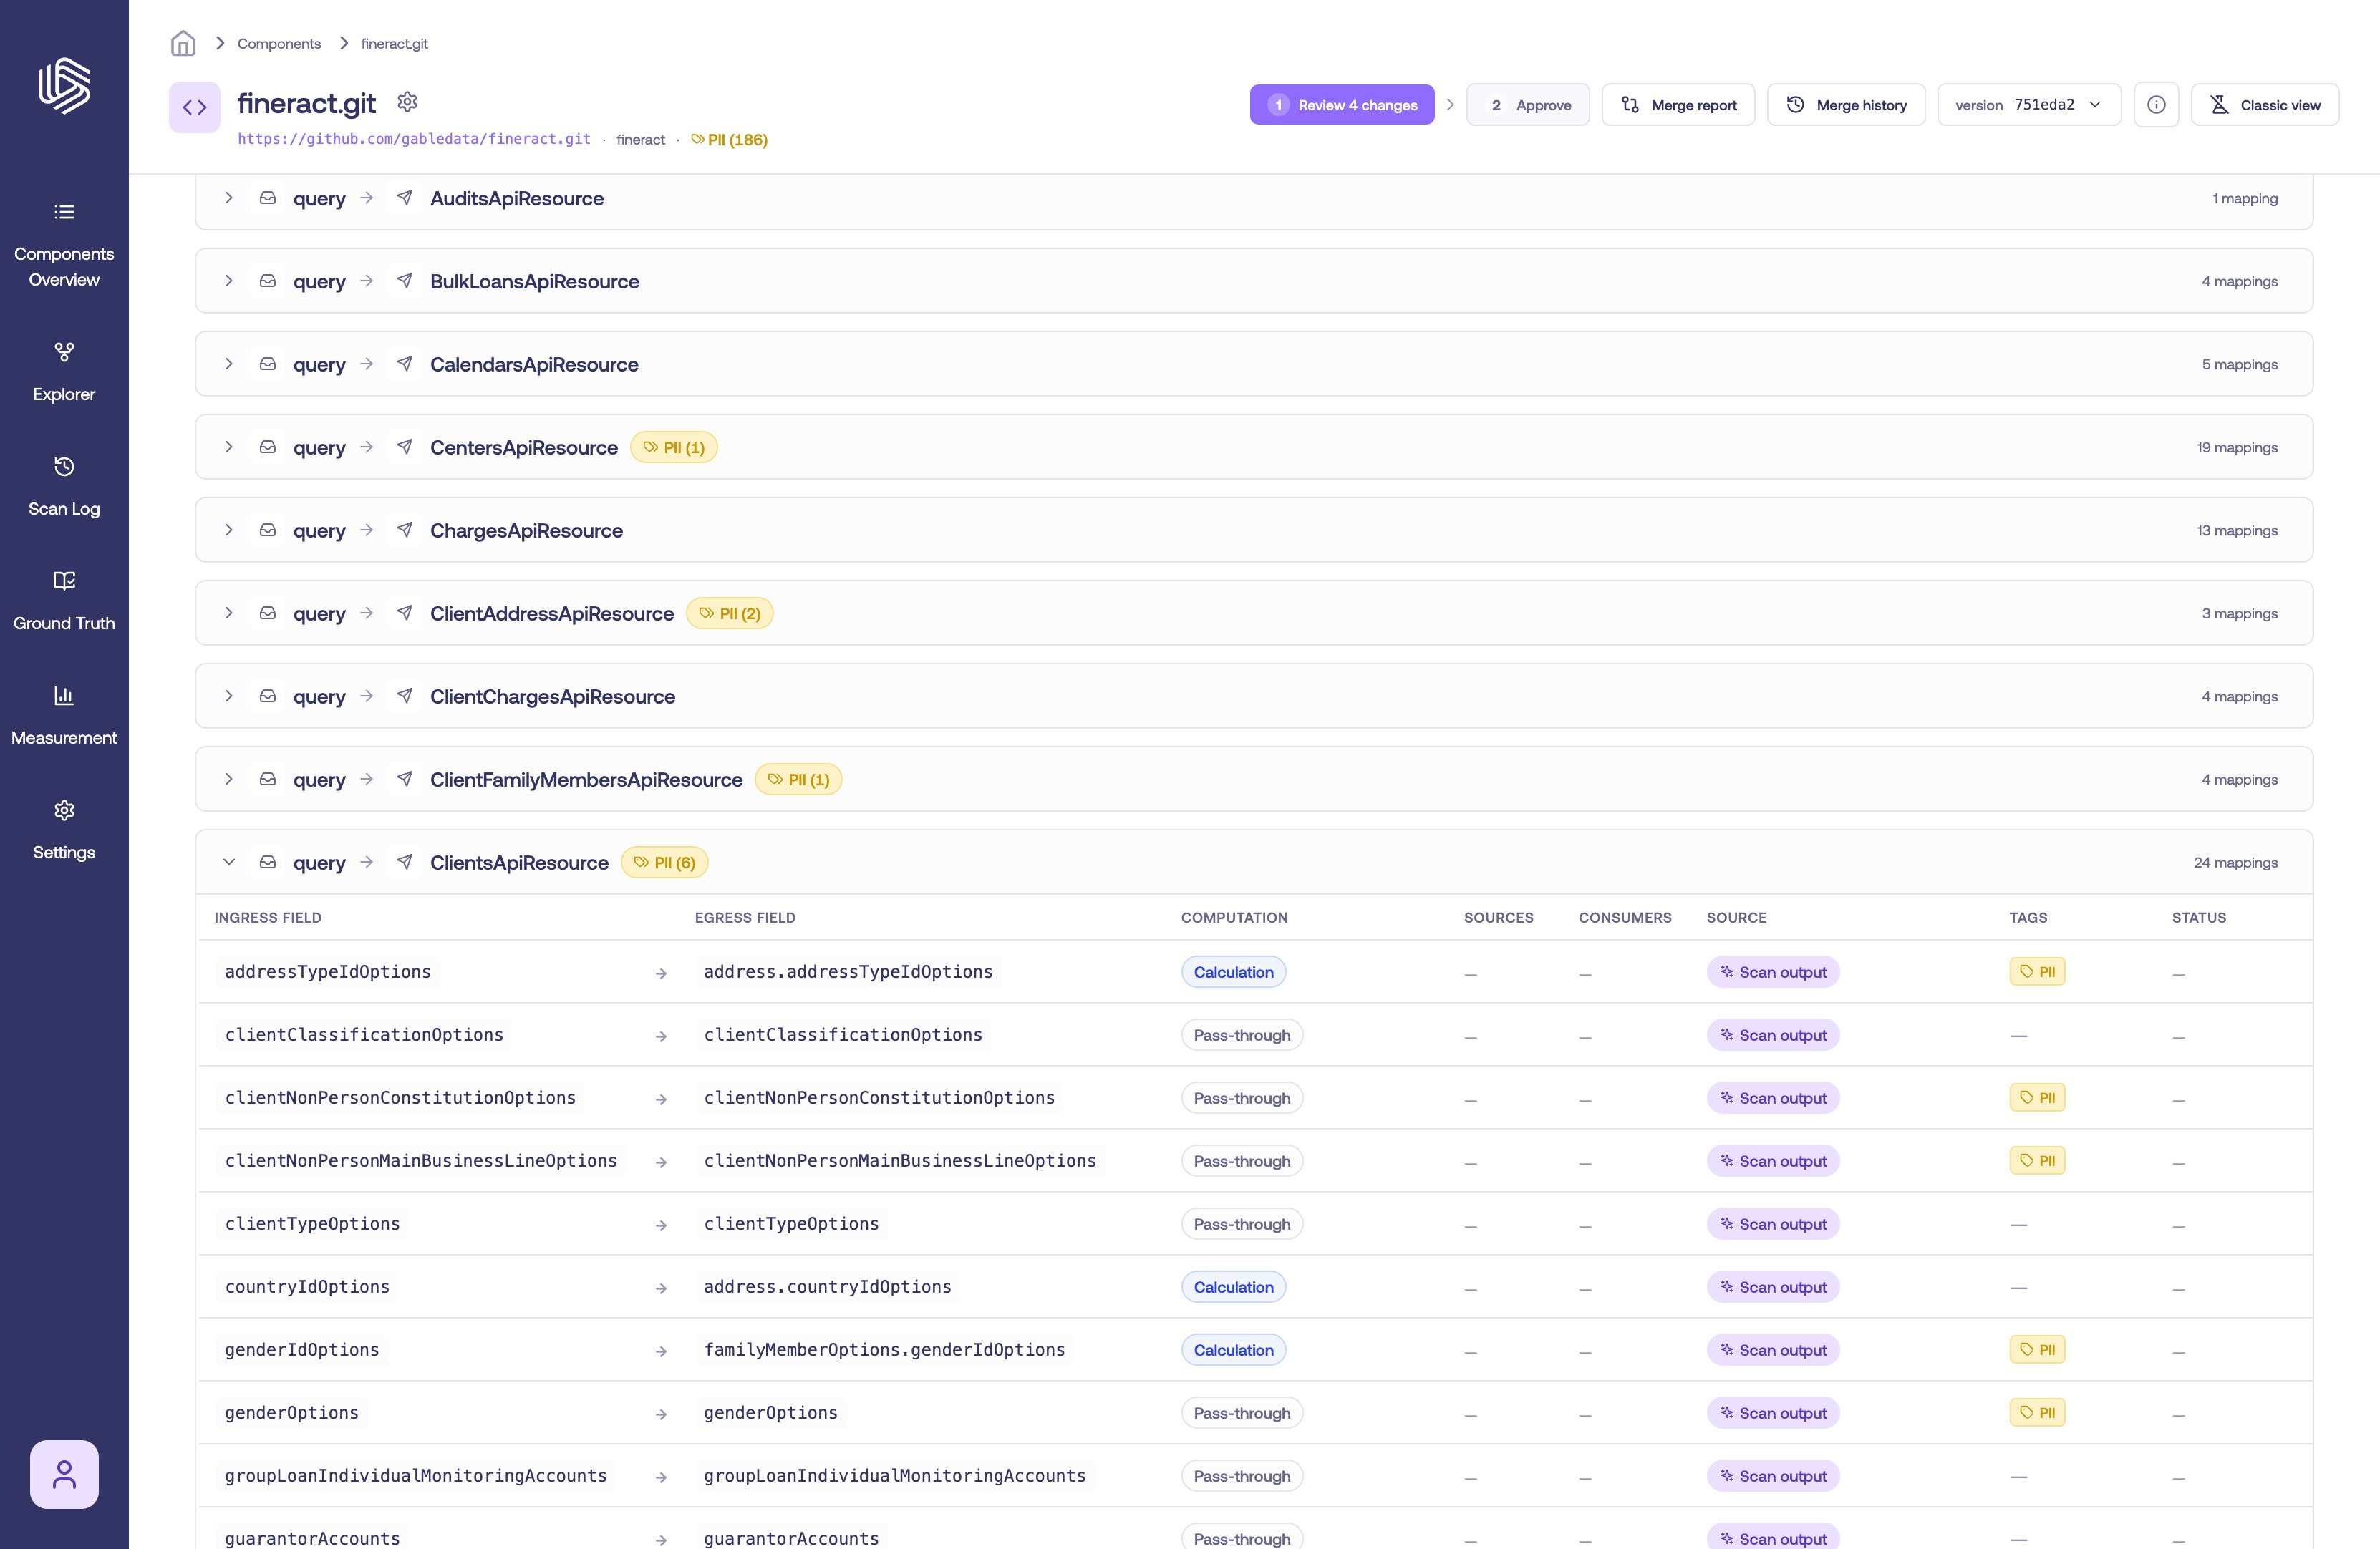
The Known dependencies table with its metadata columns
Note the difference between Sources (the count of upstream sources) and Source (the provenance of the mapping — scan output, override, or disabled).
Inspect a mapping
Select a row to open its details panel. The panel shows the ingress and egress fields, their connections (upstream sources and downstream consumers), any tags and notes, and the Code paths that produced the mapping.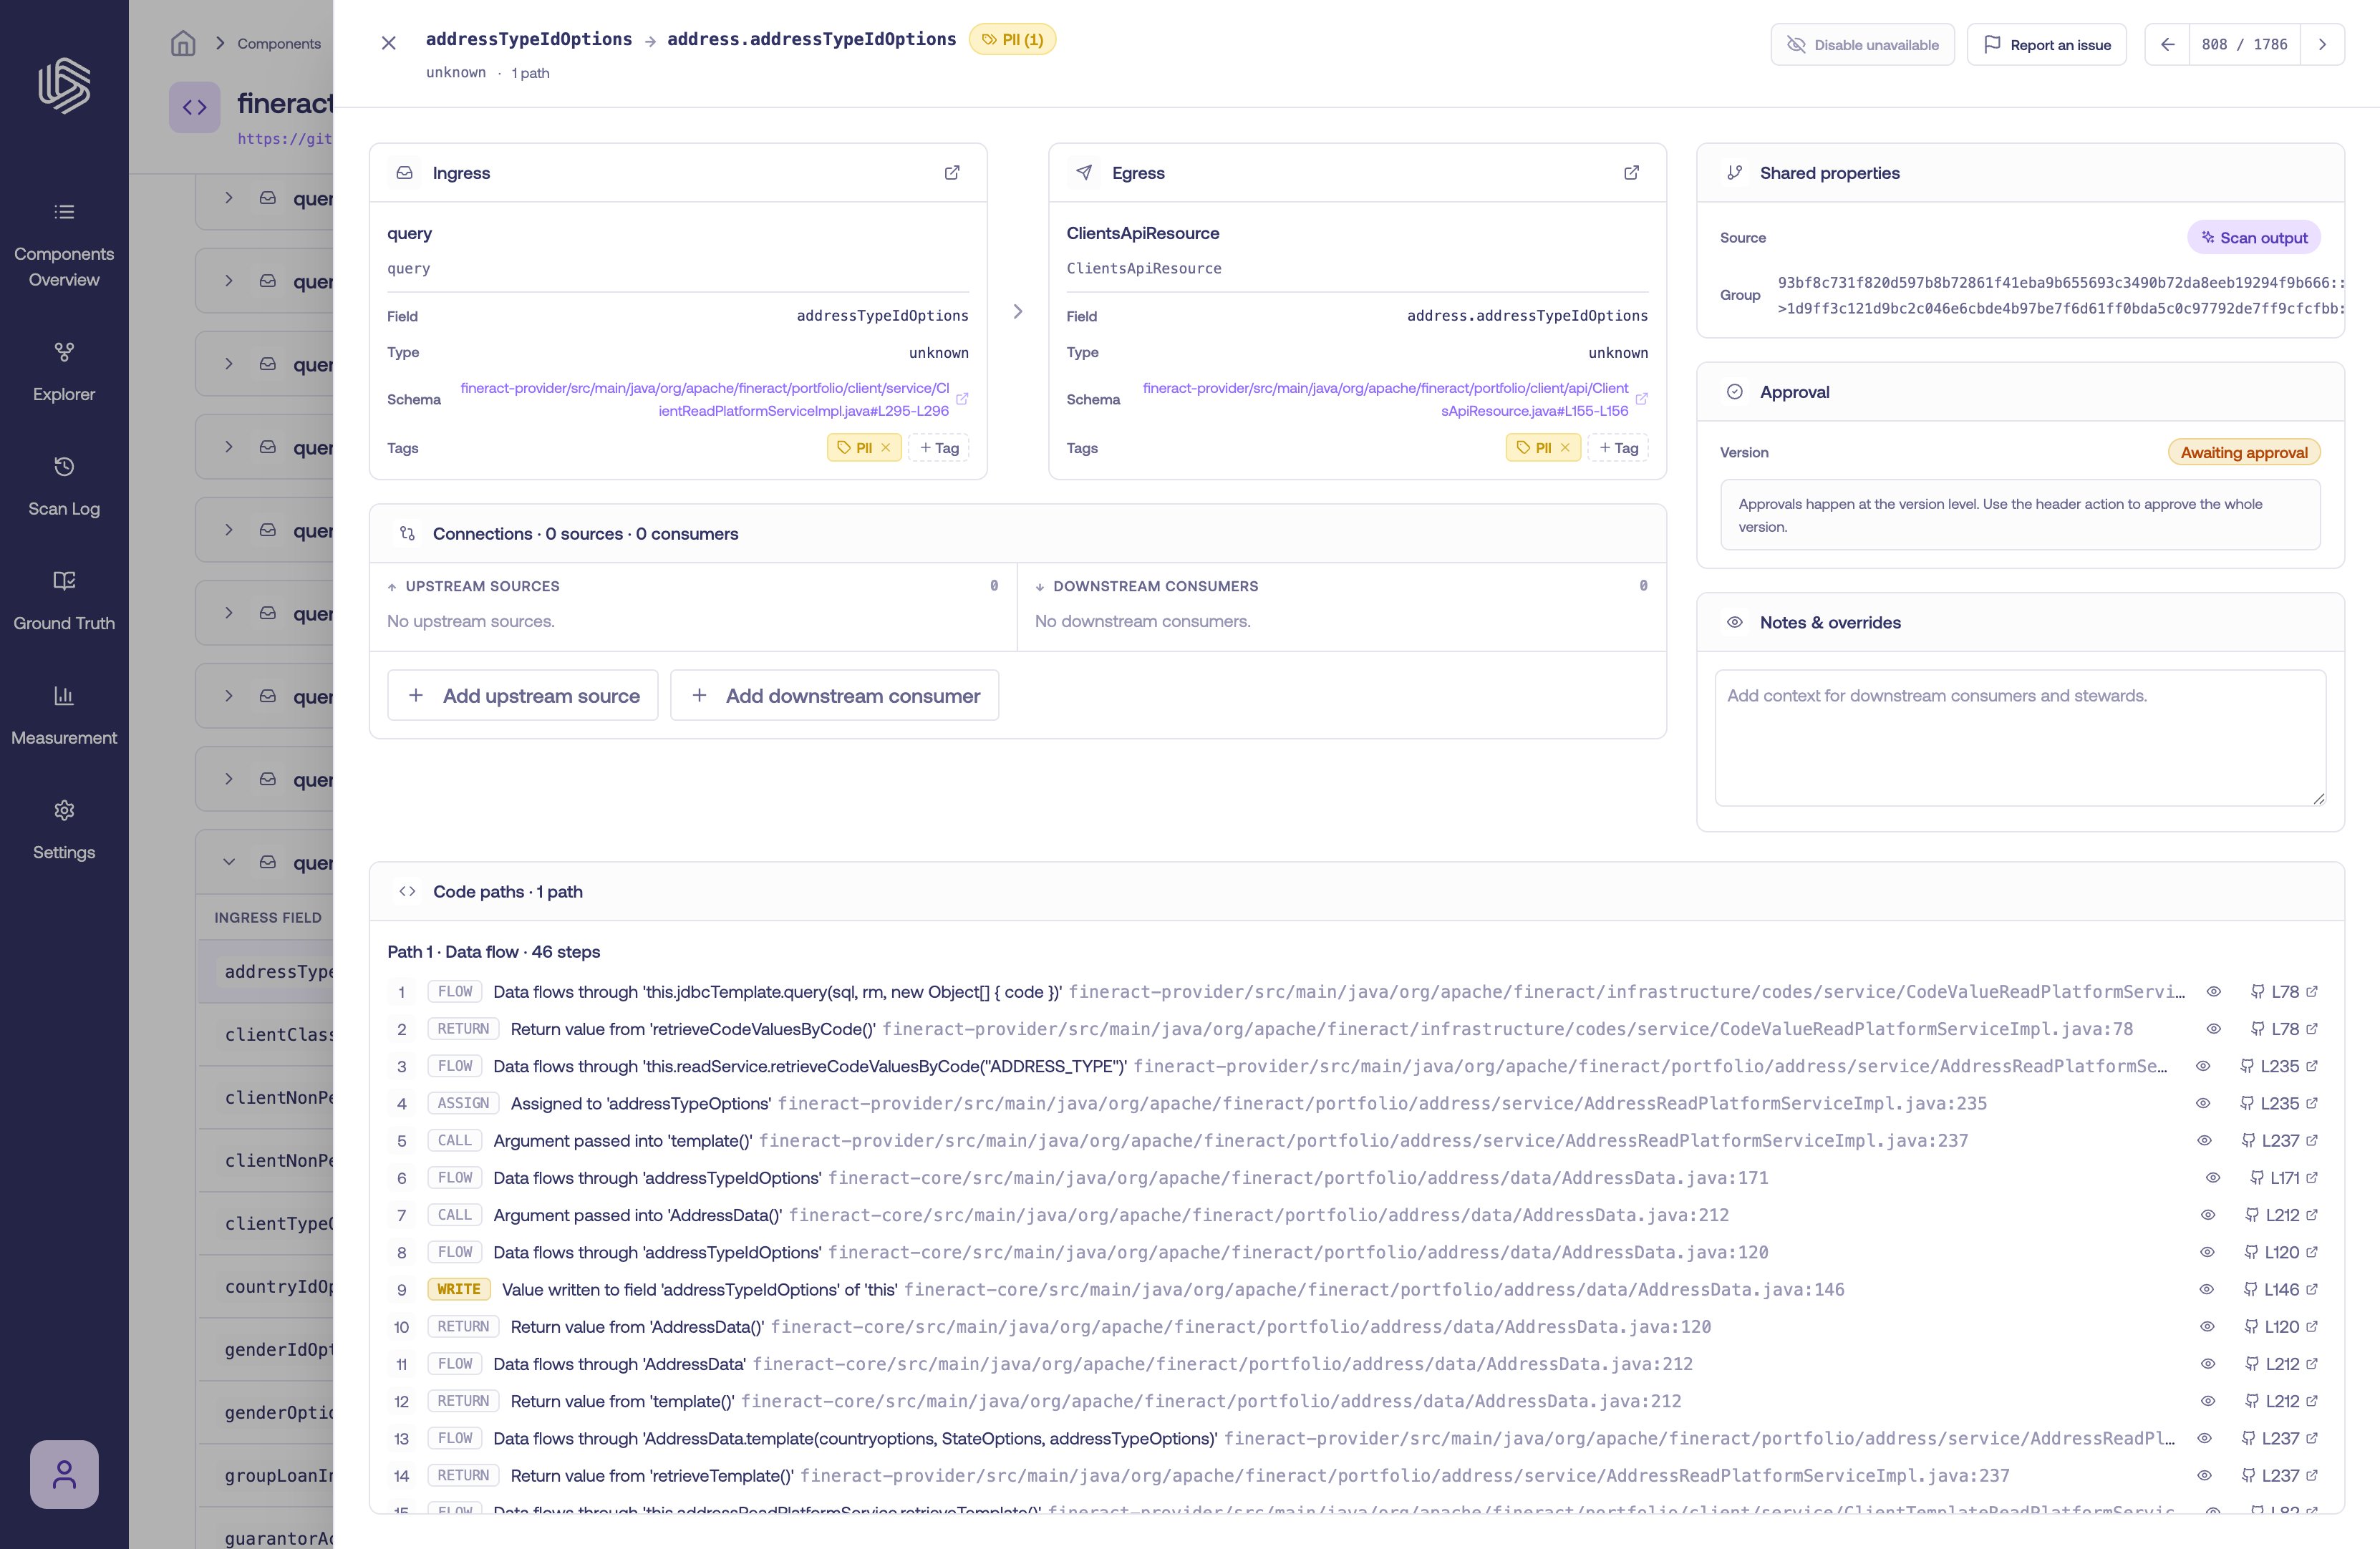
The field mapping details panel
Code path steps
The Code paths card shows how the value actually travels through the code, as one or more paths. Each path is an ordered list of numbered steps, and each step describes a single operation. Every step includes:- A classification of the operation — for example read, write, call, return, assign, or flow — so you can see what the code is doing at that point.
- A location — the file and line where the operation occurs.
- A human-readable summary — a plain-language description of the transformation happening at that step, when one is available.
- An inline code snippet — expand a step to view the relevant source inline.
- A link to GitHub — open the exact line in your repository (labeled with the line number, e.g.
L42).
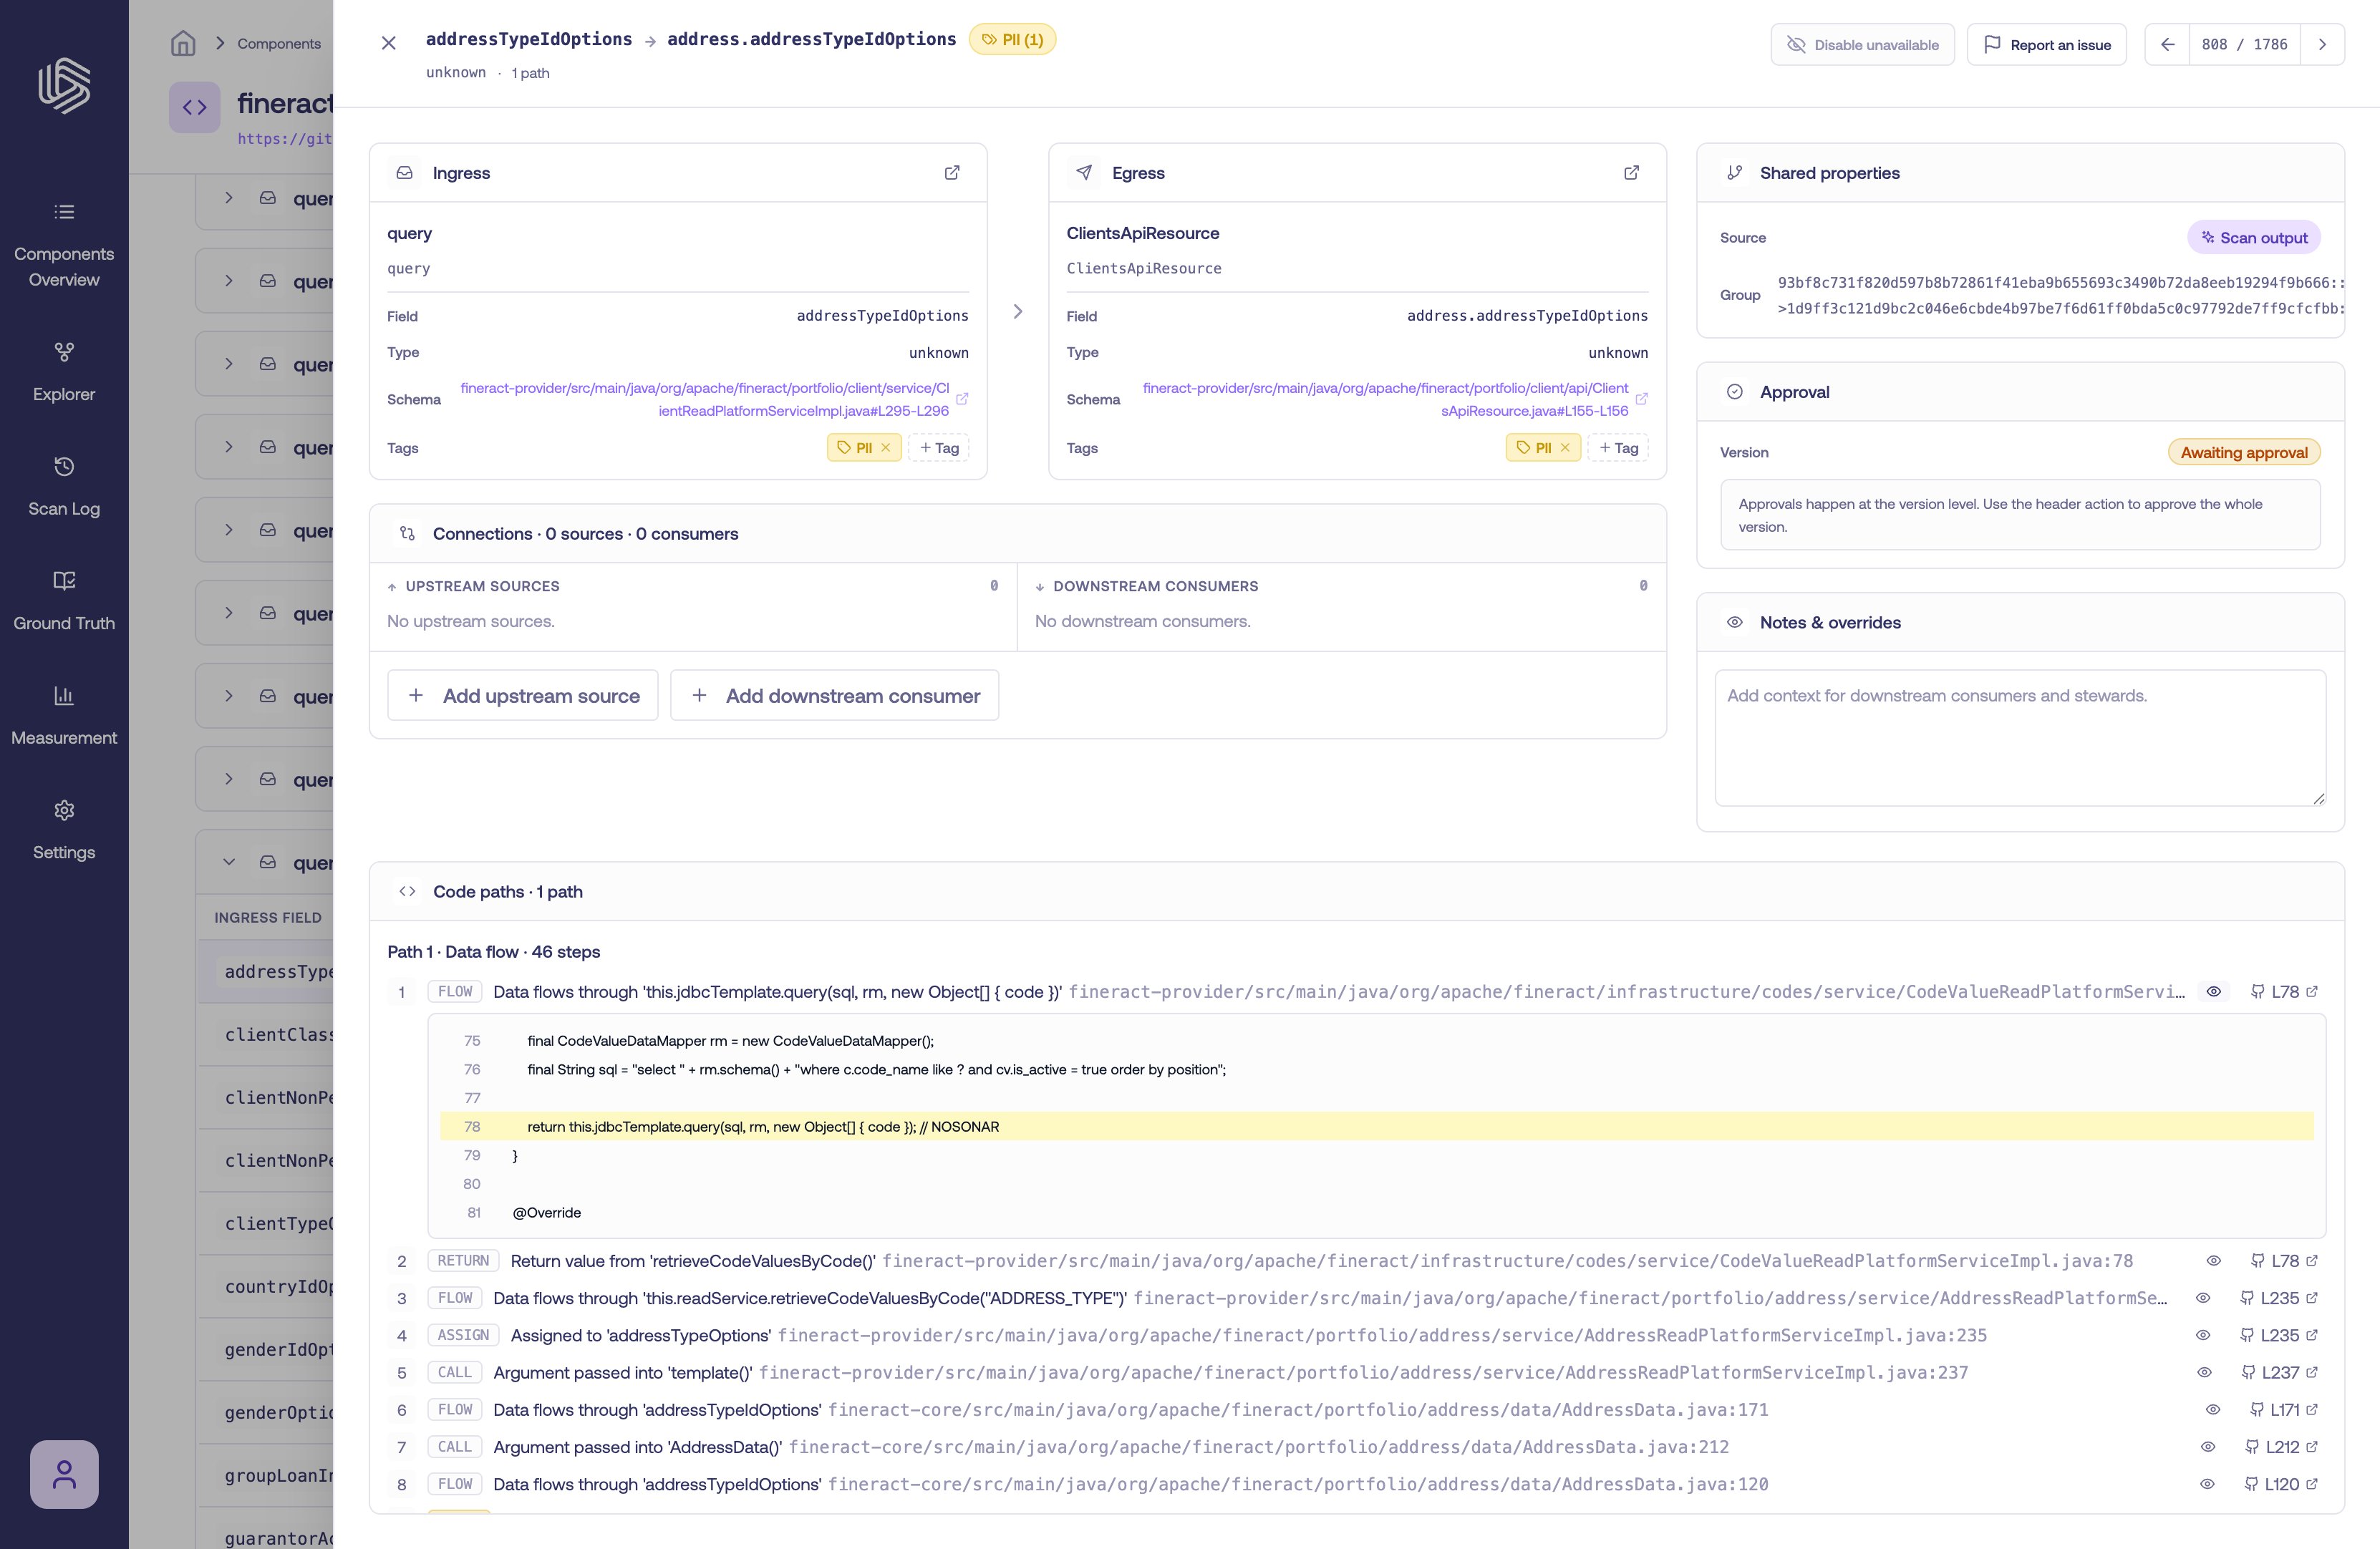
Code path steps with classifications, summaries, and source links